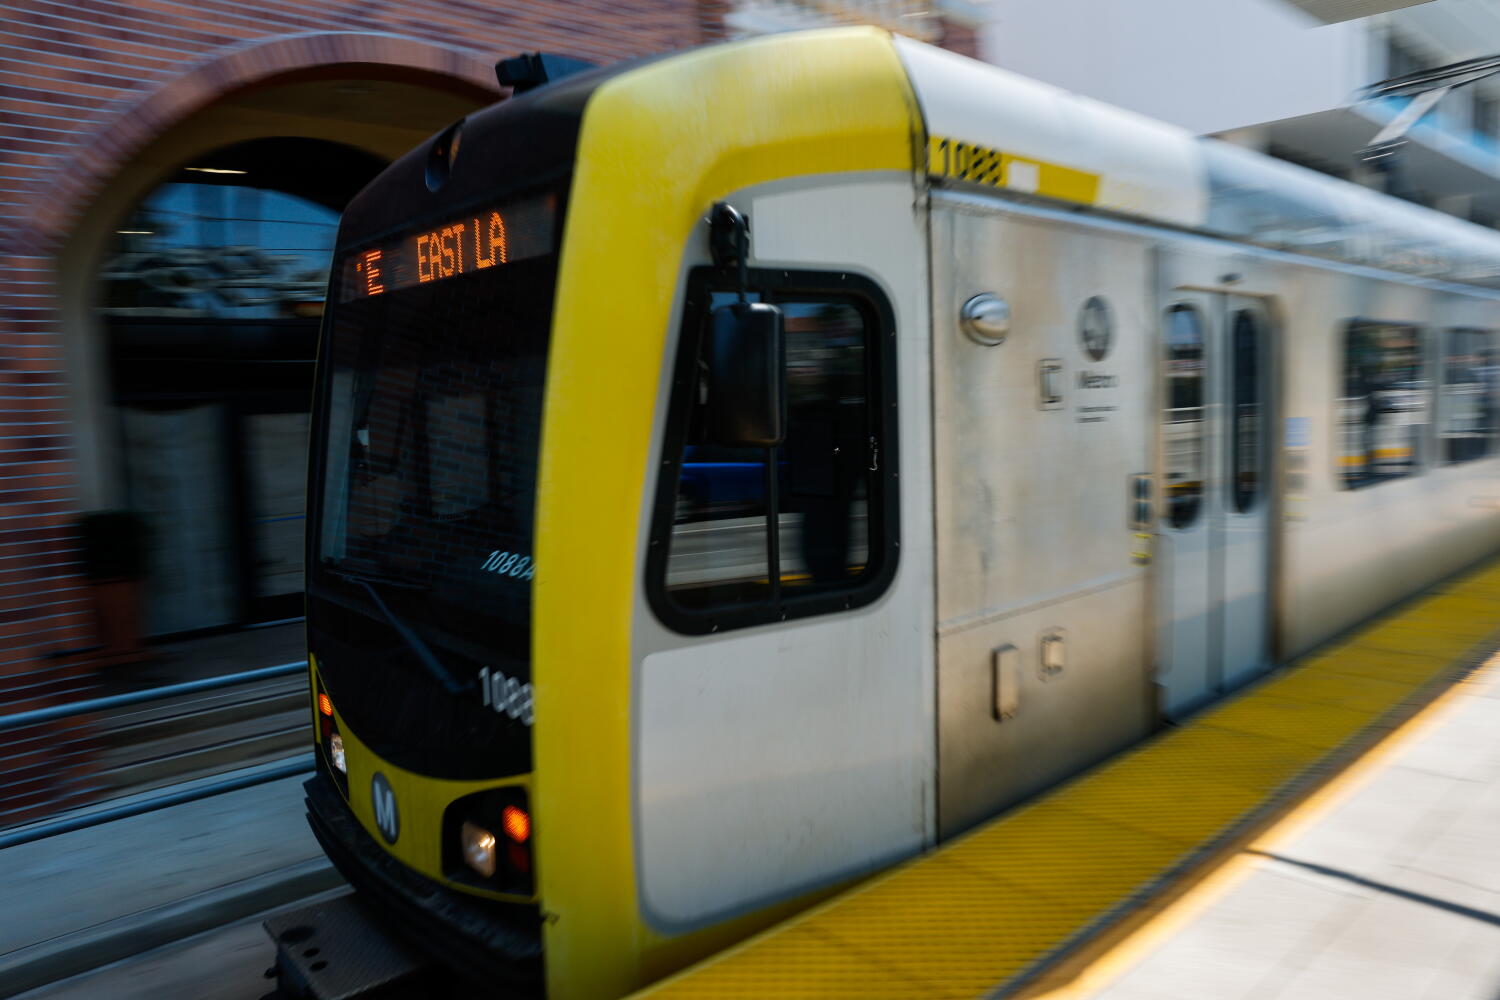
Major construction on the 6.7-mile East San Fernando Valley Light Rail Transit project began in October 2026 roughly five years behind its original schedule, with a life-of-project budget approaching $4 billion compared to the $1.3 billion estimate pitched in 2018. Treating this gap merely as a story of "construction delays" or "inflation" misses the structural mechanics of public capital delivery. A five-year schedule slip and a nearly threefold cost escalation reflect compounding sequencing risk, scope expansion, and funding stack friction across a dense urban arterial.
Standard reporting on transit groundbreakings tends to treat the start of heavy civil work as a clean inflection point where planning ends and delivery begins. In practice, groundbreakings on complex urban corridors happen while environmental reviews, utility relocations, right-of-way acquisitions, and station-area modifications remain partially unsettled. Understanding what changed between 2018 and late 2026 requires separating verified project data from analytical hypotheses about why delivery stretched out.
Deconstructing Conventional Coverage of the Delay
Typical news coverage of the East San Fernando Valley line frames the delay around four familiar themes: slow municipal approvals, traffic and business disruption along Van Nuys Boulevard, multi-layered funding wins, and long-overdue rail investment for a transit-dependent corridor. That narrative captures the surface tension in Los Angeles transit, yet it leaves major causal links unexamined.
The first analytical gap is treating schedule slip and cost growth as parallel symptoms rather than a feedback loop. When a transit line slips from a projected 2021 construction start to major civil work in October 2026, the project does not simply sit frozen at 2018 prices. Labor rates, material costs, right-of-way valuations, and engineering contingencies shift over time, which forces agencies to re-sequence contracts, assemble additional grants, and absorb carrying friction.
The second gap is conflating pre-construction groundwork with full corridor delivery. Advanced utility relocation began in December 2022, well ahead of the October 2026 major construction milestone. Reporting that treats "construction" as a single binary switch obscures how much risk sits inside utility conflicts, street-level right-of-way adjustments, and station modifications even after shovels enter the ground.
The third gap is ignoring the operational penalty of mixed-flow or street-running friction during a multi-year build. Along a major arterial like Van Nuys Boulevard, adding 11 stations between the Metro G Line and San Fernando Road means years of lane reductions, K-rail installations, and storefront access constraints, while adjacent elements—such as a proposed Pacoima Metrolink station and mobility hub pursued by the Metro board in late 2025—carry separate environmental and safety review tracks.
The Three Pillars of Capital Slippage
To evaluate why a $1.3 billion concept approved in 2018 evolved into a roughly $3.999 billion life-of-project budget targeting service in the early 2030s, it helps to organize the mechanics into three structural pillars: Time and Cost Coupling, Scope and Interface Drift, and Multi-Tier Funding Assembly.
1. Time and Cost Coupling
In public infrastructure, time is a price variable. When initial assumptions put construction starting around 2021 and trains running around 2027, the financial model relies on a specific window of cost escalation and grant timing. Once milestones slip, every subsequent phase inherits higher baseline costs.
- Escalation exposure: Post-2018 construction inflation and supply chain pressures hit heavy civil works, systems, and professional services after the initial estimate was formed.
- Contract packaging and procurement timing: Major construction contracts—such as the $2.43 billion joint venture contract awarded to Skanska in 2026—reflect market pricing at award rather than conceptual planning years earlier.
- Buffer consumption: Contingency funds designed to absorb surprises get drawn down early when schedules lengthen, requiring formal board budget actions such as the May 2026 life-of-project budget approval.
2. Scope and Interface Drift
Urban light rail is rarely an isolated track-laying exercise. Along Van Nuys Boulevard through Panorama City, Arleta, and Pacoima, the alignment intersects underground utilities, local business frontages, bus connections, and commuter rail crossings.
- Subsurface and street-level complexity: Relocating utilities and managing right-of-way along an active commercial and residential corridor adds technical dependencies that can stall civil sequencing.
- Stakeholder and safety adjustments: Local traffic and safety concerns can trigger design changes or supplemental station concepts, such as the board's December 2025 move to pursue a Pacoima Metrolink station, mobility hub, and crossing gate upgrades.
- Schedule divergence between core and add-on elements: When add-on components require separate environmental review, the core 6.7-mile initial operating section must manage schedule boundaries so secondary reviews do not indefinitely stall primary civil work.
3. Multi-Tier Funding Assembly
Mega-projects in Los Angeles rarely rely on a single checkbook. According to Metro's May 2026 life-of-project funding breakdown for the roughly $3.999 billion budget, local sources account for the largest share at nearly half (about 49.4%, or roughly $1.977 billion), paired with state funding (about 28.2%, or roughly $1.127 billion) and federal funding (about 22.4%, or roughly $894 million).
This three-layer capital stack creates both resilience and friction:
- Resilience: Spreading funding across local sales tax measures (such as Measure M and Proposition C), state programs (including Transit and Intercity Rail Capital Program grants), and federal programs (such as Expedited Project Delivery) reduces reliance on any single budget cycle.
- Friction: Each funding stream carries distinct eligibility rules, reporting milestones, and commitment dates. A known example of this alignment tension is the gap between Metro's internal target opening date of January 7, 2032, and the later August 22, 2033 date committed to federal funders.
Cause-and-Effect Chains Standard Narratives Miss
A rigorous analysis distinguishes between established facts and educated hypotheses.
Established facts:
- Metro approved the project in 2018 with initial expectations of starting construction in 2021, opening around 2027, and costing roughly $1.3 billion.
- Advanced utility relocation began in December 2022, and major construction broke ground in October 2026.
- The 6.7-mile, 11-station first phase carries a life-of-project budget of roughly $3.999 billion approved in May 2026, split across local (
49.4%), state (28.2%), and federal (~22.4%) sources. - Metro's August 2026 status report targets January 7, 2032 for service start, while the federal commitment date sits at August 22, 2033.
Educated hypotheses:
- Early schedule optimism in 2018 likely understated the friction of coordinating utility relocations, local municipal feedback, and multi-agency grant rules prior to final design maturity.
- Once inflation accelerated after 2020, bridging multi-hundred-million-dollar or billion-dollar cost gaps required sequential grant awards and local contingency reallocations, which naturally stretched pre-construction and procurement timelines rather than compressing them.
- Maintaining a buffer between the internal 2032 operational target and the 2033 federal commitment date functions as a practical governance hedge against construction and testing slippages.
The Commuter and Corridor Trade-Off
For riders who currently depend on congested surface transit along the corridor, the gap between 2027 and 2032 (or 2033) is not an abstract calendar entry. Every extra year of construction delays travel-time reliability gains for transit-dependent households while extending lane closures and business access friction along Van Nuys Boulevard.
At the same time, rail corridors alter long-run urban economics differently than surface buses. Once operational, fixed guideway infrastructure creates permanent transfer nodes—connecting to the Metro G Line and regional bus networks, with future links like the Sepulveda Transit Corridor and potential extensions in planning. How station-area zoning and land-use rules interact with construction timelines—such as housing element cycles and statutory transit-oriented rules—will shape whether transit-oriented value materializes near completion or lags behind opening day.
Operational Playbook for Corridor Stakeholders
Managing a multi-year urban rail build requires disciplined execution across three distinct stakeholder groups. None of these measures eliminates construction disruption or macro cost risk, and each carries real trade-offs.
For Transit Agencies and Program Managers
- Enforce strict scope-gate discipline on late additions. Separate secondary station or hub concepts that still require environmental clearance from the critical path of the base 6.7-mile alignment so secondary approvals do not stall core civil packages.
- Manage dual-calendar risk transparently. Track internal schedule targets against external grant commitment dates (such as the 2032 target versus the 2033 federal date) with explicit float budgets so schedule variances surface months before funding milestones are threatened.
- Tie contingency drawdowns to verified risk retirement. Release contingency funds only against documented scope, utility, or escalation triggers rather than treating contingencies as general schedule padding.
Limitation: Even tight governance cannot insulate a project from exogenous shocks such as utility strikes, labor shortages, or late third-party design changes.
For Corridor Businesses and Property Owners
- Audit block-by-block construction phasing rather than relying on corridor-wide averages. Track specific utility relocation and track-laying windows affecting each block along Van Nuys Boulevard so deliveries, customer parking expectations, and signage adapt to active work zones.
- Underwrite holding costs against realistic opening horizons. Base leasing, refinancing, and development timelines on official target dates rather than aspirational early schedules or "station-adjacent" marketing claims before track and station work advance.
- Document access impacts systematically. Maintain clear records of street closures and pedestrian access changes to engage effectively with agency mitigation and business support programs.
Limitation: Mitigation programs rarely replace full foot-traffic or curb-parking losses during peak trenching and station construction.
For Policymakers and Regional Planners
- Align housing and land-use readiness with construction milestones. Coordinate local planning cycles and station-area infrastructure upgrades so high-density or mixed-use housing near future stations is not blocked by timing mismatches.
- Standardize utility and permitting service levels before groundbreaking. Front-load utility agreements and traffic-management approvals so major contractors do not lose momentum waiting on third-party clearances.
Limitation: Policy alignment accelerates downstream readiness, but physical civil engineering still governs how fast heavy infrastructure can be built in a dense urban corridor.
Strategic Play for the Next Five Years
The decisive strategic play for the East San Fernando Valley line between now and the early 2030s is treating schedule protection as a core cost-containment strategy. Because time and cost are coupled in heavy civil construction, every quarter saved—or prevented from slipping—between 2026 and 2032 protects both the roughly $3.999 billion budget and the corridor's economic payoff.
Executives and overseers should judge progress not by ceremonial milestones, but by three hard operational metrics: utility relocation completion ahead of track crews, on-time delivery of major civil sub-packages without scope creep, and closing the gap between the internal 2032 operational target and the 2033 federal commitment. In high-density urban transit, disciplined execution during the middle years of construction—not groundbreaking announcements—determines whether a delayed project recovers value or compounds its losses.