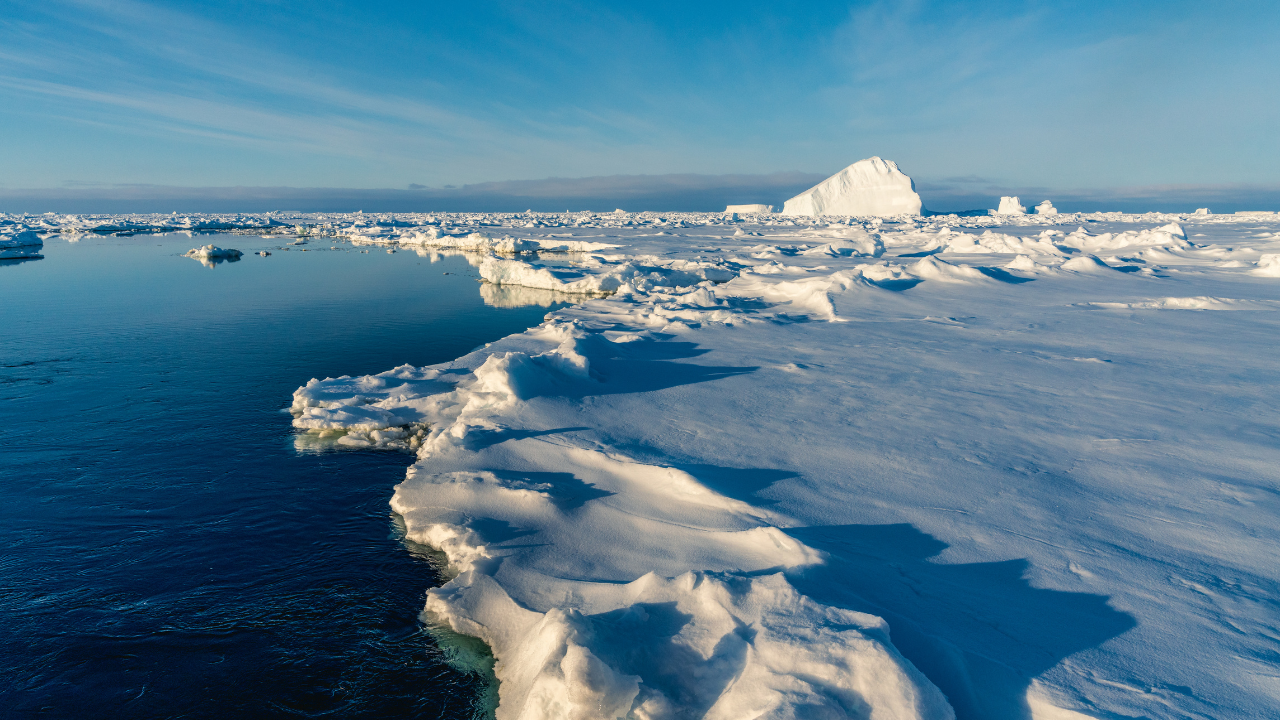
Yes, Arctic sea ice expanded for roughly a thousand years before hitting a multi-century peak around 1960, a trend driven by slow, predictable shifts in Earth's orbit and regional cooling. That single fact has become a favorite talking point for climate skeptics, who use it to argue that modern ice loss is just a natural rebound. They are right about the historical expansion, and completely wrong about what it means. When you examine the paleoclimate data—from ancient driftwood to marine sediment cores—the 1960 peak does not exonerate modern fossil fuel emissions. Instead, it proves just how violently human activity has reversed a millennial cooling trend in less than a single lifetime.
History rarely moves in straight lines. To understand why the ice grew for ten centuries and then fell off a cliff, you have to look at the mechanics of the planet before smokestacks entered the equation.
The Millennial Freeze Was Real
For most of the last millennium, the Arctic was getting colder. This was not a fluke or a localized weather anomaly. It was the tail end of a much longer climatic era known as the Neoglacial period, which began roughly 4,000 to 5,000 years ago after the warmth of the early Holocene faded.
The mechanism behind this slow freeze is basic orbital mechanics. Earth does not spin like a perfectly balanced top. Over tens of thousands of years, its axial tilt, wobble, and the shape of its orbit around the sun shift in predictable rhythms called Milankovitch cycles. During the past several thousand years, these orbital variations steadily reduced the amount of solar radiation hitting the Northern Hemisphere during summer. Less summer sun meant less seasonal melting. Year after year, century after century, the ice pack thickened and crept southward.
By the time the Little Ice Age settled over the Northern Hemisphere between the 14th and 19th centuries, the Arctic was locked in a deep freeze. Volcanic eruptions injected massive amounts of sulfur into the stratosphere, reflecting sunlight and compounding the orbital cooling. Solar output dipped during periods like the Maunder Minimum.
We know this happened because the Arctic keeps meticulous physical records. Researchers studying beach ridges along the coasts of Greenland, Svalbard, and the Canadian Arctic Archipelago have mapped the ancient shorelines. Waves only push gravel and driftwood onto beaches when the water is open and free of ice. When multi-year sea ice locks onto the coast, wave action stops, and driftwood gets stranded behind ridges of pushed-up gravel. By radiocarbon-dating thousands of pieces of ancient driftwood and fossilized whalebones trapped in these raised beaches, scientists reconstructed a clear timeline. From roughly 1000 AD until the mid-20th century, open water became increasingly rare. The ice was advancing.
Marine sediment cores tell the exact same story. Certain species of microscopic algae only live inside sea ice, leaving behind distinct chemical biomarkers called IP25 when they die and sink to the ocean floor. Drilling into the seabed reveals a steady climb in these biomarkers over the past thousand years, peaking right around the middle of the 20th century.
Why 1960 Was the Turning Point
The mid-20th century sits at a strange crossroads in climate history. If you look at global temperature charts, the planet actually experienced a slight cooling plateau between the 1940s and the 1970s.
This pause happened because post-World War II industrial expansion pumped massive amounts of sulfate aerosols into the atmosphere. Unlike carbon dioxide, which traps heat for centuries, sulfate aerosols act like microscopic mirrors, bouncing incoming sunlight back into space. Combined with natural cooling phases in the Atlantic Multidecadal Oscillation, this industrial haze temporarily masked the warming effect of rising greenhouse gases. In the high north, this brief cooling window allowed the millennial expansion of Arctic sea ice to reach one final crescendo around 1960.
Ship logs, early aerial reconnaissance flights, and coastal observation stations from Iceland to Alaska confirm that ice conditions in the late 1950s and early 1960s were remarkably severe. For a brief moment, the thousand-year trend held firm.
Then the mask came off.
Western nations passed clean air legislation in the 1970s and 1980s, scrubbing sulfur from smokestacks to stop acid rain. As the reflective sulfate haze cleared, the accumulated heat from decades of unchecked carbon dioxide and methane emissions hit the Arctic with full force. The orbital cooling that had patiently built the ice pack over a millennium was completely overwhelmed in less than twenty years.
How Skeptics Weaponize the 1960 Baseline
If you spend enough time reading contrarian blogs or listening to certain political commentators, you will eventually encounter a specific cherry-picked argument. They point out that the modern satellite record—which is the gold standard for measuring sea ice—only begins in 1979. By starting the clock in 1979, they claim, mainstream scientists are hiding the fact that ice was expanding prior to 1960, or suggesting that the current decline is simply a return to "normal" after an unusually cold spike.
This argument relies on a fundamental misunderstanding of both data timelines and physical physics.
First, scientists do not ignore pre-1979 data. The Walsh dataset, compiled by researchers at the University of Illinois and the National Snow and Ice Data Center, stitches together whaling ship logs, naval charts, aircraft observations, and Danish Meteorological Institute records dating back to 1850. Climate scientists openly acknowledge the 1960 peak because their own paleoclimate reconstructions discovered it.
Second, calling the post-1960 collapse a "natural rebound" ignores the scale and speed of the reversal. When a pendulum swings back to center, it moves at a predictable pace governed by the forces acting upon it. Orbital cycles operate on timescales of millennia. They do not suddenly reverse direction in 1965 and vaporize half the summer ice pack in fifty years.
To put the current state of the Arctic into perspective, compare the modern ice extent against the full thousand-year record, not just the 1960 peak. Even during the Medieval Warm Period around 1000 AD—when Norse settlers farmed parts of southern Greenland—Arctic sea ice was far more extensive than it is today. Biomarker data from seabed sediments shows that modern summer ice loss has already blown past anything seen in the last 1,450 years, and likely much longer. We have not just erased the gains of the Little Ice Age; we have punched straight through the baseline of the entire last millennium.
| Era | Approximate Timeline | Primary Climate Driver | Arctic Sea Ice Trend |
|---|---|---|---|
| Medieval Warm Period | 950 – 1250 AD | High solar output, low volcanic activity | Moderately reduced, though still extensive |
| Little Ice Age | 1300 – 1850 AD | Orbital cooling, volcanic aerosols, solar minima | Steady expansion and thickening |
| Mid-Century Plateau | 1940 – 1970 AD | Industrial sulfate aerosols masking CO2 | Reached multi-century peak around 1960 |
| Modern Era | 1979 – Present | Greenhouse gas accumulation, Arctic amplification | Rapid, unprecedented collapse |
The Physics of Ice Loss vs Ice Growth
Building an ice sheet is like growing an old-growth forest. Destroying it is like striking a match.
Sea ice does not just sit passively on top of the ocean; it actively regulates the temperature of the entire planet through the ice-albedo feedback loop. Bright white snow and ice reflect up to 80 percent of incoming solar radiation back into space. Dark ocean water does the exact opposite, absorbing roughly 90 percent of the sun's energy.
During the thousand-year expansion leading up to 1960, this feedback loop worked in favor of the ice. Slightly cooler summers allowed more ice to survive into autumn. That extra ice reflected more sunlight the following spring, keeping the water cold and encouraging even thicker multi-year ice to form. Multi-year ice—ice that has survived at least two summer melt seasons—can grow three to four meters thick. It is dense, low in salinity, and stubbornly resistant to melting.
Once temperatures began rising rapidly in the late 20th century, the feedback loop flipped into reverse. Warmer air melted the snow cover earlier in the spring, exposing darker bare ice underneath. Ponds of meltwater pooled on the surface, absorbing solar heat and boring holes straight through the floes. Once the ice retreated, the exposed dark ocean absorbed massive amounts of summer heat. That stored heat delayed freeze-up in the autumn, meaning the new winter ice formed later and grew thinner.
Today, the Arctic has lost the vast majority of its thick, resilient multi-year ice. In the mid-1980s, ice older than four years made up roughly a third of the Arctic winter ice pack. By the mid-2020s, that old ice had shrunk to a tiny fraction—often less than three or four percent—huddled tightly against the northern coast of Greenland and the Canadian islands. The modern Arctic is dominated by thin first-year ice, which forms in the winter and melts away easily the following summer.
This loss of structural thickness explains why the 1960 peak is so critical to understand. In 1960, the Arctic had a massive thermal buffer built up over ten centuries of cooling. Over the last six decades, human-driven warming has liquidated that entire buffer.
What the Paleoclimate Record Actually Warns Us About
When you strip away the political spin, the thousand-year expansion of Arctic ice before 1960 serves as a stark warning rather than a comforting excuse.
Paleoclimate records give us a baseline for how Earth's climate system behaves when left to its own devices. They show us the exact speed limit of natural climate change. Under natural orbital forcing, it took roughly ten centuries of persistent cooling to nudge the Arctic ice edge outward to its 1960 maximum.
Humanity reversed that entire thousand-year trajectory in less than six decades.
Furthermore, the Arctic is not warming at the same rate as the rest of the globe. Due to the ice-albedo feedback loop and shifts in atmospheric heat transport, the region is heating up nearly four times faster than the global average—a phenomenon known as Arctic amplification. As the temperature gap between the frigid pole and the warm equator narrows, the high-altitude jet stream weakens and becomes wavier. A sluggish, wavy jet stream locks weather patterns in place for weeks at a time, fueling prolonged heatwaves, catastrophic floods, and deep winter freezes across North America, Europe, and Asia.
At the same time, the disappearance of sea ice leaves coastal permafrost exposed to pounding autumn storms, accelerating erosion and threatening to thaw billions of tons of trapped organic carbon. Meanwhile, freshwater runoff from the rapidly melting Greenland Ice Sheet pours into the North Atlantic, threatening to slow down the Atlantic Meridional Overturning Circulation—the massive ocean conveyor belt that keeps European winters mild and regulates global rainfall patterns.
The data from 1960 is completely legitimate, and anyone interested in climate science should look at it closely. It shows a dynamic, shifting planet governed by clear physical laws. Those exact same laws tell us that a thousand years of orbital cooling does not vanish overnight on its own, and the ice that took ten centuries to build is not coming back anytime soon.